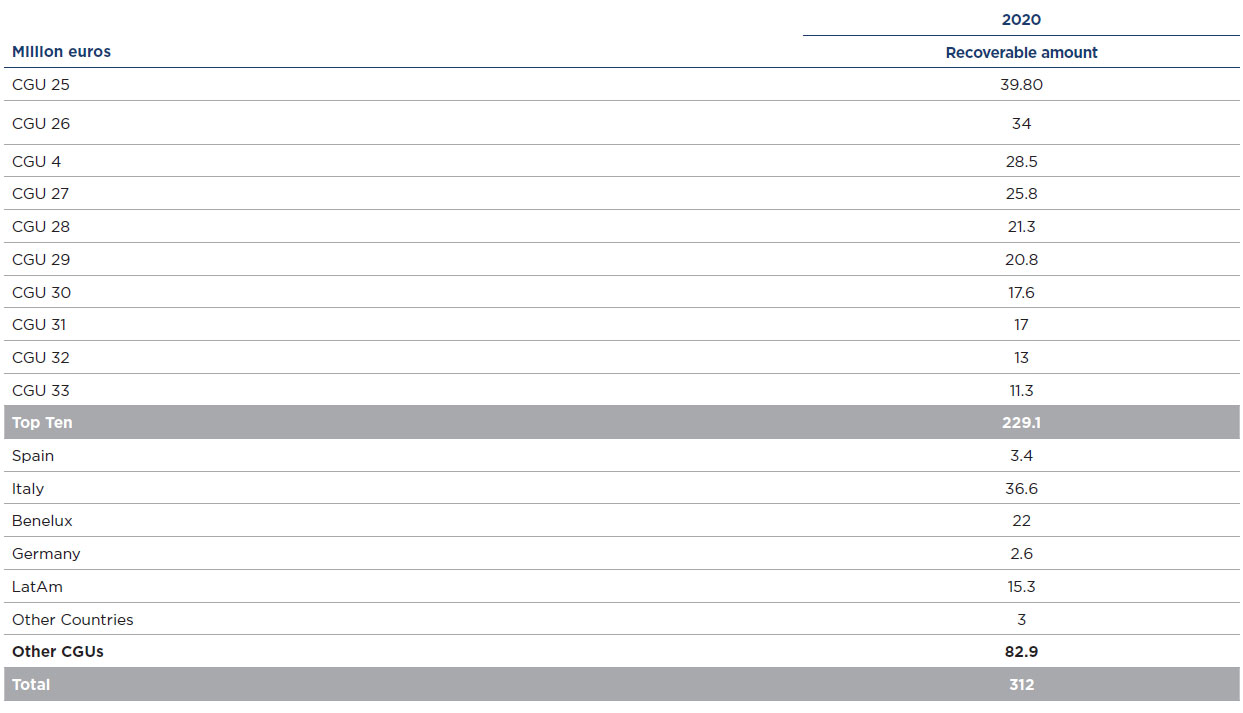
The Group evaluates the possible existence of a loss of value each year that would oblige it to reduce the carrying amounts of its assets. As a result of the crisis caused by the spread of Covid-19, impairment analysis carried out by the Group in the financial year determined that losses be recognised for impairment losses.
11.1 Key assumptions used to calculate value in use
The value in use of each CGU is determined discounting its future cash flows. These are estimated based on the result for the year and the records of at least five previous years. Given the uncertainty stemming from the current economic environment, macroeconomic information from external information sources has been analysed and with Group Management’s business knowledge, different evolution and forecast possibilities have been made on the most likely basis, taking the effect of the pandemic into account.
The evolution of the key assumptions in the analysed hotels has taking the business knowledge of Group Management into account as well as the expected recovery of the sector after the Covid-19 pandemic. In this regard, the assumed projections are based on the Management’s budget for 2021, which assumes a dramatic fall in revenues compared to 2019 due to the negative effect that the Covid-19 pandemic has had on tourism, one of the most affected sectors. It is estimated that the loss of business in 2020 will be recovered in the next three years, beginning in the second half of 2021 once mobility restrictions are eased as vaccination progresses and therefore consumer confidence recovers. The Group’s strong positioning in the countries where it operates, the good locations of the portfolio and the high recognition of its brands are key factors in the assumed recovery period up to 2023 and 2024, when it is hoped to reach the figures of the period prior to the pandemic, which was the 2019 financial year.
There are a number of factors that are considered by the Group’s Management to make the projections, which are:
• Estimate of external sources specialising in the hotel sector, along with investment banks with reference to the recovery of the hotel sector.
• Estimate of GDP (Gross Domestic Product) growth issued by the International Monetary Fund (IMF) in its report published in October of each year for the next five years.
• Knowledge of the business/asset/local situation of the local Management of each Business Unit to which each CGU belongs.
• Historical results obtained by the CGUs.
• Investments in repositioning the CGUs.
These factors are reflected in the cash flows through the following working hypotheses used to obtain the projections:
• Income from accommodation is projected as the product of percentage occupation, and average rate per room (“ADR” Average Daily Rate: is the ratio of the total income from rooms in a specific period divided by the rooms sold in that specific period) and the total rooms available per year.
• The other revenues are projected based on the average of the relationship between the revenue from accommodation and those revenues.
• Staff costs are calculated based on the average staff costs with a growth in the inflation index (CPI).
• Direct expenses are directly associated with each of the revenues and are projected on the basis of an average ratio, while undistributed
expenses are projected based on the average ratio between these and direct expenses.
• For its part, tax is calculated from the tax rates applicable in each country.
The discount rates were calculated by a third party using the Weighted Average Cost of Capital (WACC) methodology: Weighted Average Cost of Capital (WACC), as follows:
WACC=Ke*E/(E+D) + Kd*(1-T)*D/(E+D)
Where:
Ke: Cost of Equity
Kd: Cost of Financial Debt
E: Own Funds
D: Financial Debt
T: Tax Rate
The Capital Asset Pricing Model (CAPM) is used to estimate the cost of equity (ke).
The main variables used by a third party to calculate the discount rate are as follows:
• Risk-free rate: is obtained from the standard average profitability of state bonds in each country including an adjustment for country risk and an inflation differential where appropriate.
• Market risk premium: defined as 6.5% (6.8% in 2019), based on market reports.
• Beta or systematic risk: Using a sample of listed companies whose businesses are comparable to our business, the sector’s risk differential is estimated in relation to the average risk on the global market. In addition, the adjusted average financial structure of the aforementioned sample of companies was considered (63% Own Funds, 37% Debt) to calculate the re-leveraged beta coefficient, as well as the relevant tax rate in each country.
• Debt cost, estimated as an average differential over the Euribor at 12 months over 10 years, plus an adjustment for inflation and country risk in countries with a currency other than the Euro.
Below are the pre-tax discount rates of the major countries:


