COMMITMENT TO OUR STAKEHOLDERS
Environmental sustainability
45
Energy data for hotels included in the five-year Strategic Plan (48% of the total portfolio). Source: ENABLON & KHALIX
* The electricity consumption data are obtained from the invoices and the meter readings.
** The ratios are calculated in kilowatts/hour per room and night.
Energy consumption data for comparable hotels (67.2% of the
total portfolio). Source: ENABLON & KHALIX
* The electricity consumption data are obtained from the invoices
and the meter readings.
** The ratios are calculated in kilowatts/hour per room and night.
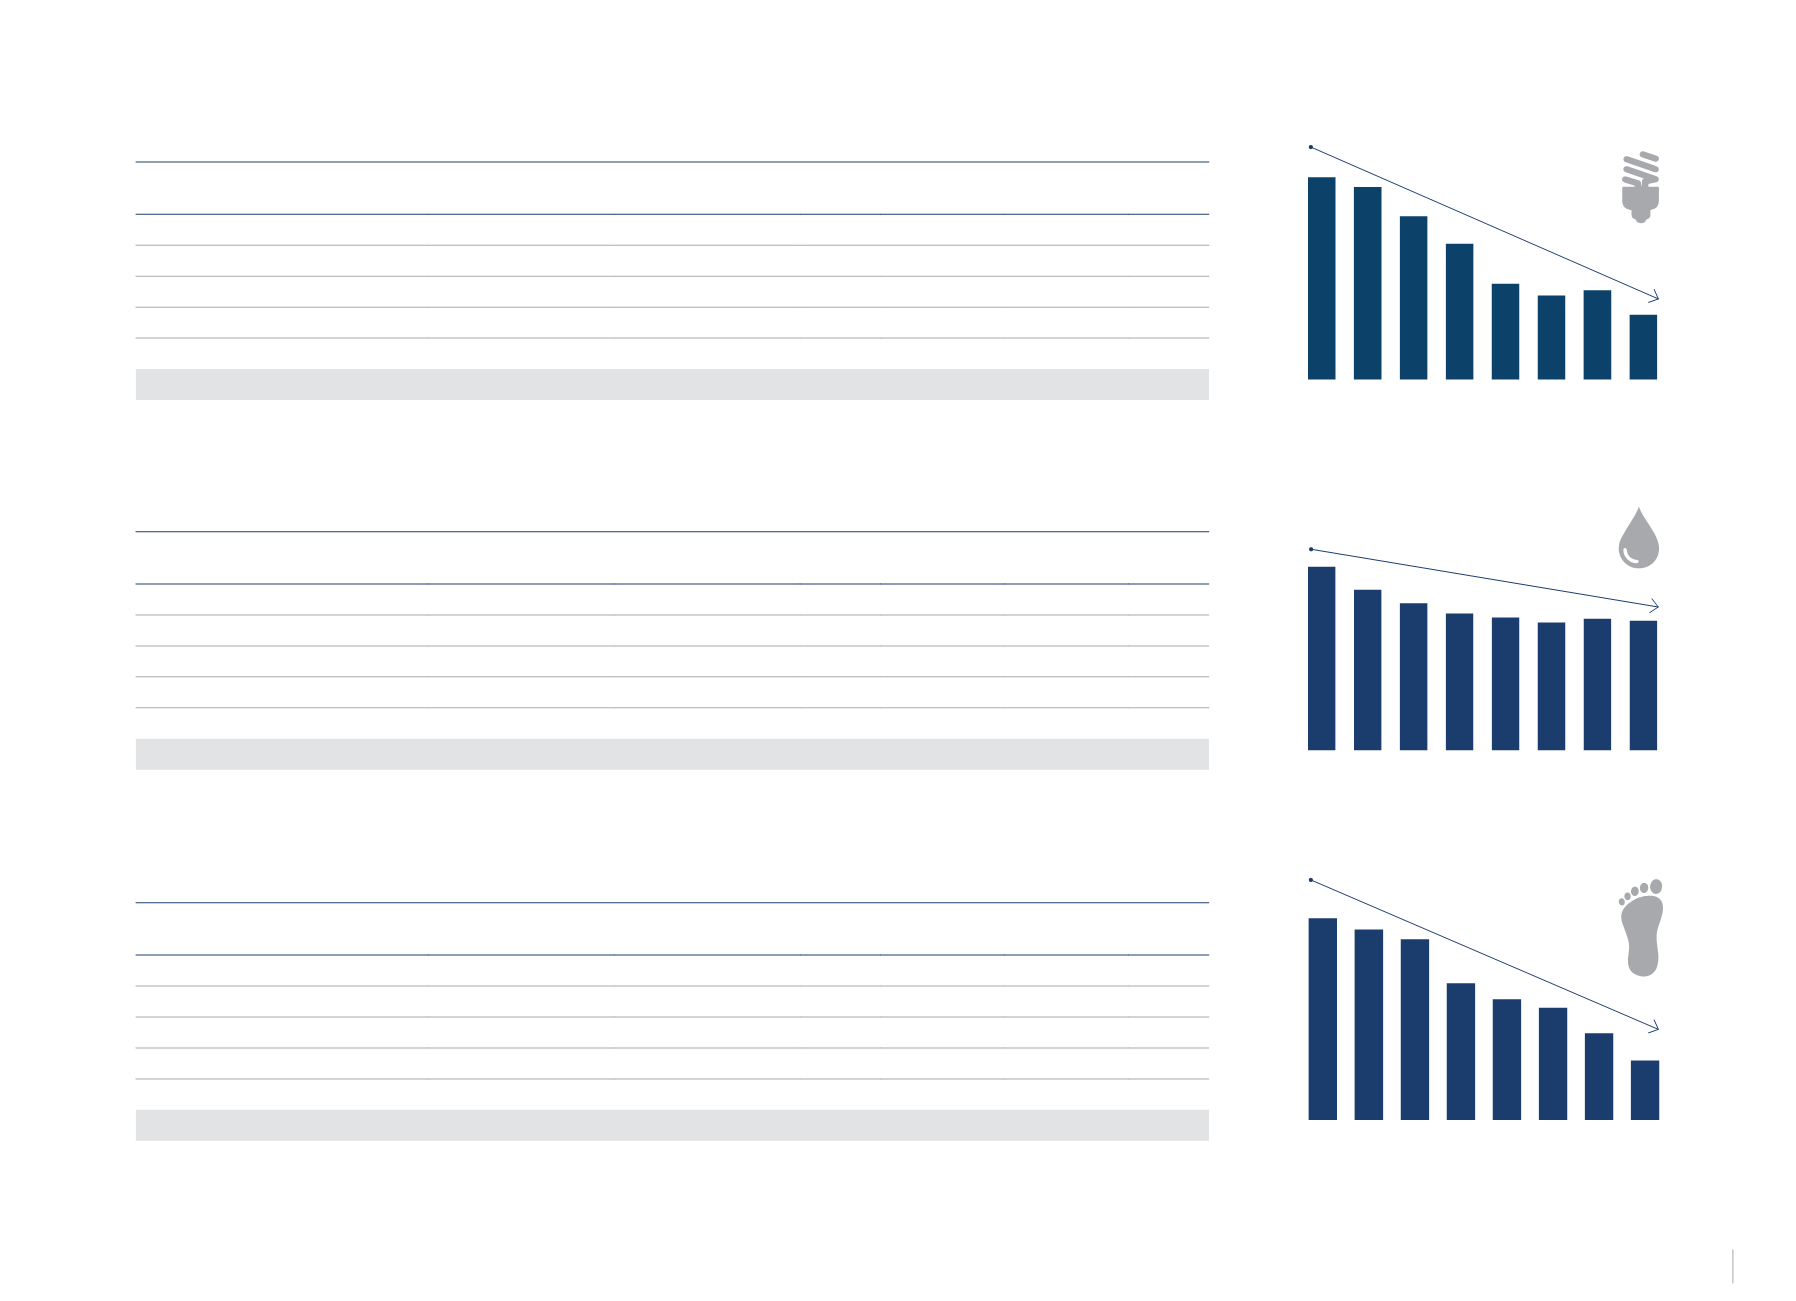
ENERGY CONSUMPTION*
kWh/RN**
ENERGY CONSUMPTION
ENERGY CONSUMPTION
2013 (kWh)
ENERGY CONSUMPTION
2014 (kWh)
DIFF 13
vs 14 (%)
ENERGY ratio
2013 (kWh/RN)
ENERGY ratio
2014 (kWh/RN)
DIFF 13
vs 14 (%)
BU America
17,571,049
17,662,184
0.5%
54.82
53.74
-2.0%
BU Benelux, United Kingdom, France & Africa
114,431,123.50
108,270,474
-5.4%
80.20
75.88
-5.4%
BU Central Europe
124,453,928
113,793,750
-8.6%
46.51
41.53
-10.7%
BU Italy
67,669,663
62,734,964
-7.3%
57.28
52.77
-7.9%
BU Spain, Portugal & Andorra
59,421,863
57,844,072
-2.7%
45.57
43.90
-3.7%
TOTAL
383,547,626.5
360,305,444
-6.1%
55.52
51.43
-7.4%
51.56
53.53
52.42
54.17
60.16
64.25
68.63
70.09
-26.4%
2007 2008 2009 2010 2011
2012 2013 2014
Water consumption data for comparable hotels (57.9% of the
total portfolio). Source: ENABLON & KHALIX
* The water consumption data are obtained from the invoices
and the meter readings.
** The ratios are calculated in cubic metres of water per room
and night.
Water data for hotels included in the five-year Strategic Plan (42% of the total portfolio). Source: ENABLON & KHALIX
* The water consumption data are obtained from the invoices and the meter readings.
** The ratios are calculated in cubic metres of water per room and night.
WATER CONSUMPTION
WATER CONSUMPTION
2013 (m
3
)
WATER CONSUMPTION
2014 (m
3
)
DIFF 13
vs 14 (%)
WATER Ratio
2013 (m
3
/RN)
WATER Ratio
2014 (m
3
/RN)
DIFF 13
vs 14 (%)
BU America
114,602
110,022.50
-4.0%
0.428
0.407
-4.9%
BU Benelux, United Kingdom, France & Africa
444,978.50
513,434.10
15.4%
0.305
0.350
14.5%
BU Central Europe
633,402
620,355.50
-2.1%
0.261
0.243
-4.5%
BU Italy
374,125
372,664.90
-0.4%
0.388
0.384
-0.9%
BU Spain, Portugal & Andorra
296,164
297,209.30
0.00%
0.289
0.288
-0.1%
TOTAL
1,863,271.50
1,913,686.30
2.7%
0.303
0.300
-1.0%
WATER CONSUMPTION*
m
3
/RN**
0.304
0.304
0.301
0.313
0.322
0.346
0.378
0.432
-30.6%
2007 2008 2009 2010 2011
2012 2013 2014
Carbon footprint data for comparable hotels (67.2% of the total
portfolio). Source: ENABLON & KHALIX
* Carbon footprint calculated using the GHG Protocol Methodology.
** The ratios are calculated in kilos of carbon dioxide equivalent per
room and night.
Carbon footprint data for hotels included in the five-year Strategic Plan (48% of the total portfolio). Source: ENABLON & KHALIX
*Carbon footprint calculated using the GHG Protocol Methodology.
**The ratios are calculated in kilos of carbon dioxide equivalent per room and night.
CARBON FOOTPRINT*
kgCO
2
/RN**
CARBON FOOTPRINT
TOTAL EMISSIONS
2013 (kgCO
2
)
TOTAL EMISSIONS
2014 (kgCO
2
)
DIFF 13
vs 14 (%)
EMISSIONS RATIO
2013 (kgCO
2
/RN)
EMISSIONS RATIO
2014 (kgCO
2
/RN)
DIFF 13
vs 14 (%)
BU America
5,819,749.31
5,868,070.38
0.8%
18.16
17.85
-1.7%
BU Benelux, United Kingdom, France & Africa
17,494,496.83
14,835,450.05
-15.2%
12.26
10.37
-15.4%
BU Central Europe
15,167,175.64
13,054,377.37
-13.9%
5.67
4.76
-16.0%
BU Italy
6,155,138.04
5,500,056.14
-10.6%
5.21
4.63
-11.2%
BU Spain, Portugal & Andorra
6,111,903.82
5,601,102.86
-8.4%
4.69
4.25
-9.3%
TOTAL
50,748,463.64
44,859,056.79
-11.6%
7.35
6.40
-12.9%
6.58
7.44
12.02
12.91
14.63
19.29
20.33
21.52
-69.4%
2007 2008 2009 2010 2011
2012 2013 2014


