43
responsible commitment
Environmental sustainability
Energy data for Total Consolidated L4L hotels. Source: SUSTAIN FOCUS & KHALIX.
* The electricity consumption data are obtained from the invoices and the meters readings.
** The ratios are calculated in kilowatts/hour per room and night.
ENERGY CONSUMPTION*
kWh/RN**
energy consumption
total energy
consumption ytd 2014
(kWh)
total energy
consumption ytd 2015
(kWh)
DIFf 14
vs 15 (%)
energy ratio
ytd 2014
(kWh/RN)
energy ratio
ytd 2015
(kWh/RN)
DIFf 14
vs 15 (%)
BU Mexico
3,040,374
3,088,040
1.6%
50.27
48.10
-4.3%
BU Mercosur
15,657,700
15,180,876
-3.0%
51.26
51.67
0.8%
BU Benelux, United Kingdom, France & Africa
90,154,151
94,412,358
4.7%
66.26
69.16
4.4%
BU Central Europe
108,941,176
111,668,169
2.5%
41.87
44.52
6.3%
BU Italy
64,746,028
66,575,242
2.8%
49.97
50.48
1.0%
BU Spain, Portugal & Andorra
76,828,932
78,161,417
1.7%
44.26
43.15
-2.5%
TOTAL
359,368,361
369,086,102
2.7%
48.83
50.14
2.7%
Water data for Total Consolidated L4L hotels. Source: SUSTAIN FOCUS & KHALIX.
* The water consumption data are obtained from the invoices and the meter readings.
** The ratios are calculated in cubic meters per room and night.
water consumption
total water
consumption ytd 2014
(m
3
)
total water
consumption ytd 2015
(m
3
)
DIFf 14
vs 15 (%)
water ratio
ytd 2014
(m
3
/RN)
water ratio
ytd 2015
(m
3
/RN)
DIFf 14
vs 15 (%)
BU Mexico
25,305
27,540
8.8%
0.418
0.429
2.5%
BU Mercosur
52,146
50,882
-2.4%
0.385
0.380
-1.5%
BU Benelux, United Kingdom, France & Africa
467,184
472,393
1.1%
0.320
0.315
-1.6%
BU Central Europe
571,337
547,122
-4.2%
0.247
0.245
-0.9%
BU Italy
432,102
437,746
1.3%
0.386
0.382
-0.9%
BU Spain, Portugal & Andorra
452,980
467,550
3.2%
0.285
0.284
-0.3%
TOTAL
2,001,053
2,003,233
0.1%
0.300
0.298
-0.6%
WATER CONSUMPTION*
m
3
/RN**
Carbon Footprint data for Total Consolidated L4L hotels. Source: SUSTAIN FOCUS & KHALIX.
*Carbon footprint calculated using the GHG Protocol Methodology.
**The ratios are calculated in kilos of carbon dioxide equivalent per room and night.
CARBON FOOTPRINT*
kg CO
2
/RN**
carbon footprint
total emissions ytd
2014 (kgCO
2
)
total emissions ytd
2015 (kgCO
2
)
DIFf 14
vs 15 (%)
carbon
footprint
ratio ytd 2014
(kgCO
2
/RN)
carbon
footprint
ratio ytd 2015
(kgCO
2
/RN)
DIFf 14
vs 15 (%)
BU México
1,472,839
1,402,234
-4.8%
24.35
21.84
-10.3%
BU Mercosur
4,038,433
3,723,198
-7.8%
13.22
12.67
-4.1%
BU Benelux, United Kingdom, France & Africa
13,215,439
12,812,509
-3.0%
9.71
9.38
-3.4%
BU Central Europe
12,245,751
12,858,145
5.0%
4.71
5.13
8.9%
BU Italy
5,707,734
5,712,385
0.1%
4.41
4.33
-1.7%
BU Spain, Portugal & Andorra
7,721,920
7,862,508
1.8%
4.45
4.34
-2.4%
TOTAL
44,402,116
44,370,978
-0.1%
6.03
6.03
-0.1%
Water data for Total Consolidated L4L hotels. Source: SUSTAIN
FOCUS & KHALIX
* The water consumption data are obtained from the invoices and
the meter readings.
** The ratios are calculated in cubic meters per room and night.
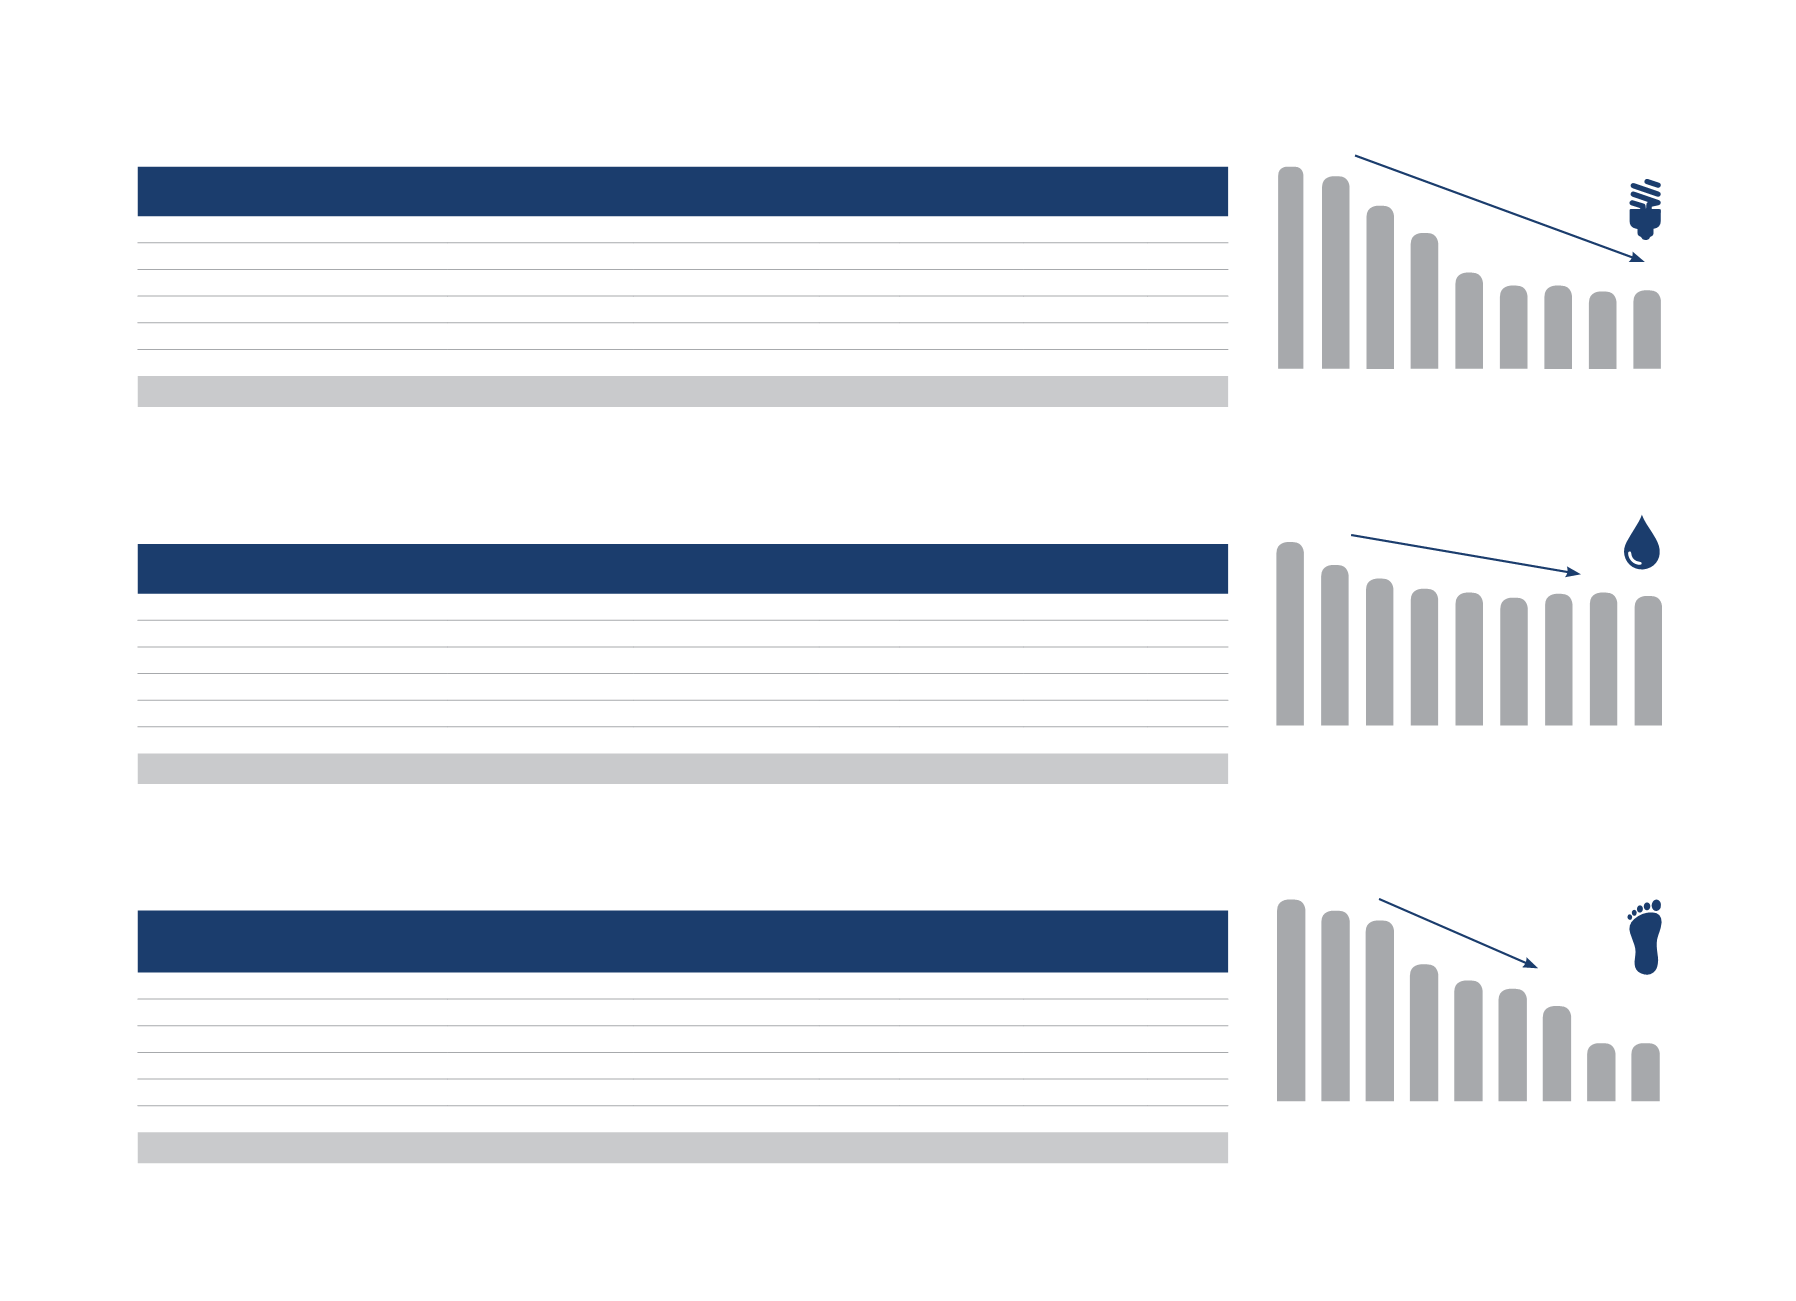
-31%
0.432
2007
0.378
2008
0.346
2009
0.322
2010
0.313
2011
0.301
2012
0.292
2013
0.298
2015
0.300
2014
Energy data for Total Consolidated L4L hotels. Source: SUSTAIN
FOCUS & KHALIX
* The electricity consumption data are obtained from the invoices
and the meters readings.
** The ratios are calculated in kilowatts/hour per room and night.
-29%
70.09
2007
68.63
2008
64.25
2009
60.16
2010
54.17
2011
52.42
2012
52.43
2013
48.83
2014
50.14
2015
Carbon Footprint data for Total Consolidated L4L hotels. Source:
SUSTAIN FOCUS & KHALIX
* Carbon footprint calculated using the GHG Protocol Methodology.
** The ratios are calculated in kilos of carbon dioxide equivalent per
room and nightresultados obtenidos en hoteles del Plan Estratégico.
-72%
21.52
2007
20.33
2008
19.29
2009
14.63
2010
12.91
2011
12.02
2012
8.97
2013
6.03
2014
6.03
2015


