The Group evaluates the possible existence of a loss of value each year that would oblige it to reduce the carrying amounts of its tangible and intangible assets or reverse them, if appropriate. A loss is deemed to exist when the recoverable value is less than the carrying amount. The recoverable value of the assets is the greater of their fair value less the costs of transfer or disposal by another means (mainly used for hotel assets in ownership) and their value in use.

As an exception, given the current economic situation as a result of the pandemic caused by COVID-19, analyses have continued to be carried out to determine if there is any impairment to the CGUs as a whole in the 2021 financial year, in the same way as in the 2020 financial year.

The value in use is calculated from the estimated future cash flows, discounted at a discount rate after tax that reflects the current market valuation with respect to the value of money and the specific risks associated with the asset, covering a five-year period and a perpetual value, except in the case of leased hotels that correspond to the term of the lease, a perpetual value therefore not being considered in the latter. Value in use has been calculated for all the CGUs.

For the purposes of determining fair value for the owned hotels in this financial year, the Group made a valuation of the greater part of the hotel assets in ownership. The valuation was made by a global firm specialising in valuation and consultancy services. The valuation of the assets at 31 December 2021 covered 70 assets. In order to calculate the value of the assets, the most used valuation criteria was discounted cash flow, due to the fact that the hotel investments are valued depending on their potential future income.

11.1 Key assumptions used to calculate value in use

The evolution of the key assumptions in the analysed hotels has taking the business knowledge of Group Management into account as well as the expected recovery of the sector after the COVID-19 pandemic. In this regard, the assumed projections are based on the use of the Management’s budget for 2022, which assumes a dramatic recovery in revenues compared to 2021, but still lower than those in 2019 due to the negative effect that the COVID-19 pandemic has had on tourism over the past two years. Recovery to pre-COVID-19 levels is calculated in the comparable hotels over the next few years, once mobility restrictions decrease and, therefore, consumer confidence is recovered. The Group’s strong positioning in the countries where it operates, the good locations of the portfolio and the high recognition of its brands are key factors in the assumed recovery period. This recovery scenario calculates reaching pre-pandemic figures in the comparable hotels, which are those for 2019, between 2023 and 2024.

There are a number of factors that are considered by the Group’s Management to make the projections, which are:

    • Estimate of external sources specialising in the hotel sector, along with investment banks with reference to the recovery of the hotel sector.
    • Estimate of GDP (Gross Domestic Product) growth issued by the International Monetary Fund (IMF) in its report published in October of each year for the next five years.
    • Knowledge of the business/asset/local situation of the local Management of each Business Unit to which each CGU belongs.
    • Historical results obtained by the CGUs.
    • Investments in repositioning the CGUs.

These factors are reflected in the cash flows through the following working hypotheses used to obtain the projections:

    • Income from accommodation is projected as the product of percentage occupation, and average rate per room (“ADR” Average Daily Rate: is the ratio of the total income from rooms in a specific period divided by the rooms sold in that specific period) and the total rooms available per year.
    • The other revenues are projected based on the average of the relationship between the revenue from accommodation and those revenues.
    • Personnel expenses are calculated on the basis of the average cost for personnel plus the relevant increase in each country referenced to the collective employment agreement for each year.
    • Direct expenses are directly associated with each of the revenues and are projected on the basis of an average ratio, while undistributed expenses are projected based on the average ratio between these and direct expenses.
    • For its part, tax is calculated from the tax rates applicable in each country.

The discount rates were calculated by a third party using the Weighted Average Cost of Capital (WACC) methodology: Weighted Average Cost of Capital (WACC), as follows:

WACC=Ke*E/(E+D) + Kd*(1-T)*D/(E+D)

Where:
Ke: Cost of Equity
Kd: Cost of Financial Debt
E: Own Funds
D: Financial Debt
T: Tax Rate

The Capital Asset Pricing Model (CAPM) is used to estimate the cost of equity (ke).

The main variables used by a third party to calculate the discount rate are as follows:

    • Risk-free rate: the WACC calculation is based on an increased risk-free rate. The risk-free rate is standardised to show the average sustainable performance of the long-term bonds issued by governments and considered to be “safe” (usually those classified as AAA by the main ratings agencies).
      • For European countries, a rate of 0% was taken into account as the performance of German government bonds at 20 years, on the valuation date, showed negative performance from December 2021 and a 1.5% standardisation was extended.
      • For Latin American countries, American sovereign debt was taken into account, which oscillates between 1.8% (performance at the Valuation Date) and 2.5% (standardised value). In these countries, the differential of inflation to the USA is also applied.
      • For the United Kingdom, the performance of British government bonds at 20 years was taken into account, which oscillates between 1.2% (performance at the Valuation Date) and 2.5% (standardised value).
    • Market risks premium: defined at 5.5% for rates in EUR and USD and 5.0% for GBP, based on a wide range of financial information, multiple methodologies and economic and financial market conditions at December 2021.
    • Beta or systematic risk: Using a sample of listed companies whose businesses are comparable, the sector’s risk differential is estimated in relation to the average risk on the global market. To calculate the WACC for hotels being leased, a comparative of a sample of traditional hotel companies is taken into account. Furthermore, to this group, and to calculate the WACC for owned hotels, a sample of property investment funds (REITs) is also included in order to show the real estate contribution to the business. Bloomberg’s historic betas were taken as a reference (monthly data at 5 years). Given that these betas are leveraged, they have been de-leveraged taking into account the average historical debt/capital structure for each company over 5 years.
    • The capital structure applied was estimated on the basis of the capital structure of the comparable companies, taking the proportion of debt with interest, preferential capital and ordinary capital of these companies that are listed on the stock exchange into consideration. The average capital structure applied is 59.5% Own Funds and 40.5% Debt for the group of comparables for owned hotels, and 58.1% Own Funds and 41.9% Debt for the group of comparables for leased hotels.
    • In addition, the local rate for corporation tax on the valuation date in each country was considered.
    • To calculate the Cost of the debt, a 2.9% debt differential is applied, based on the spot rate of German bonds at 20 years and applying the credit rating differential for the comparable companies of reference.

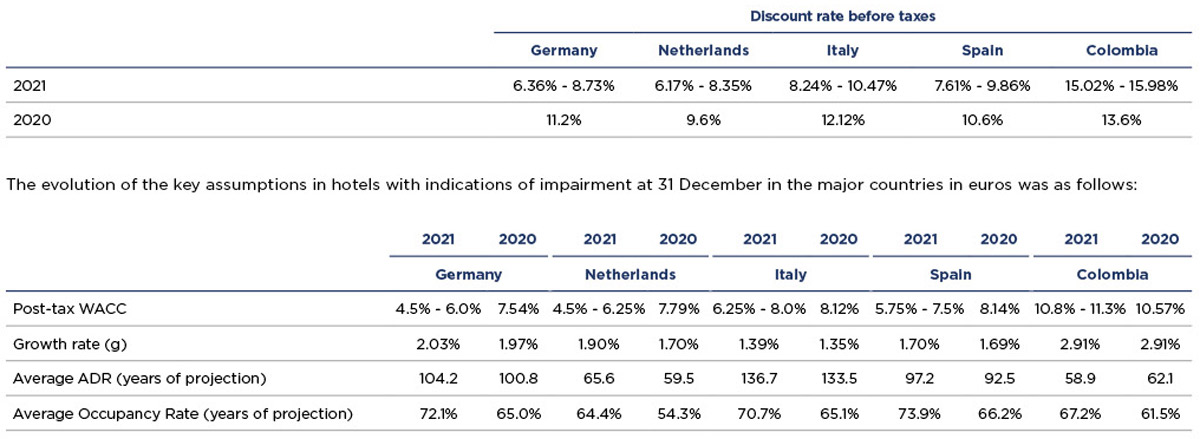
Below are the pre-tax discount rates of the major countries:

The after-tax discount rates used by the Group for these purposes range in Europe from 4.5% to 10.25% (7.5% and 8.1% in 2020) and in Latin America from 9.00% to 14.5% (10.6% and 16.2% in 2020) without taking into account Argentina, whose after-tax discount rate has been calculated taking into account its hyperinflationary economic situation and varies between 52.50% in 2022 and 33.25% in 2026, and standardised to 18.5% for the perpetuity calculation based on the estimate of inflation. In this regard, the cash flows resulting from the impairment tests were also calculated after tax. In addition, the book value to which the value-in-use is compared does not include any deferred tax liabilities which could be associated with the assets.

Using a post-tax discount rate and post-tax cash flows is consistent with paragraph 51 of IAS 36, which states that “estimated future cash flows will reflect assumptions that are consistent with the manner of determining the discount rate”. In addition, the result of the post-tax flows updated at a post-tax discount rate would obtain uniform results with respect to the impairment test if a pre-tax rate were used and, therefore, the impairment and reversion accounting records would be uniform.

11.2 Sensitivity analysis

Furthermore, the Group has carried out a sensitivity analysis for each of the CGUs, and for the groups of CGUs where goodwill is allocated.

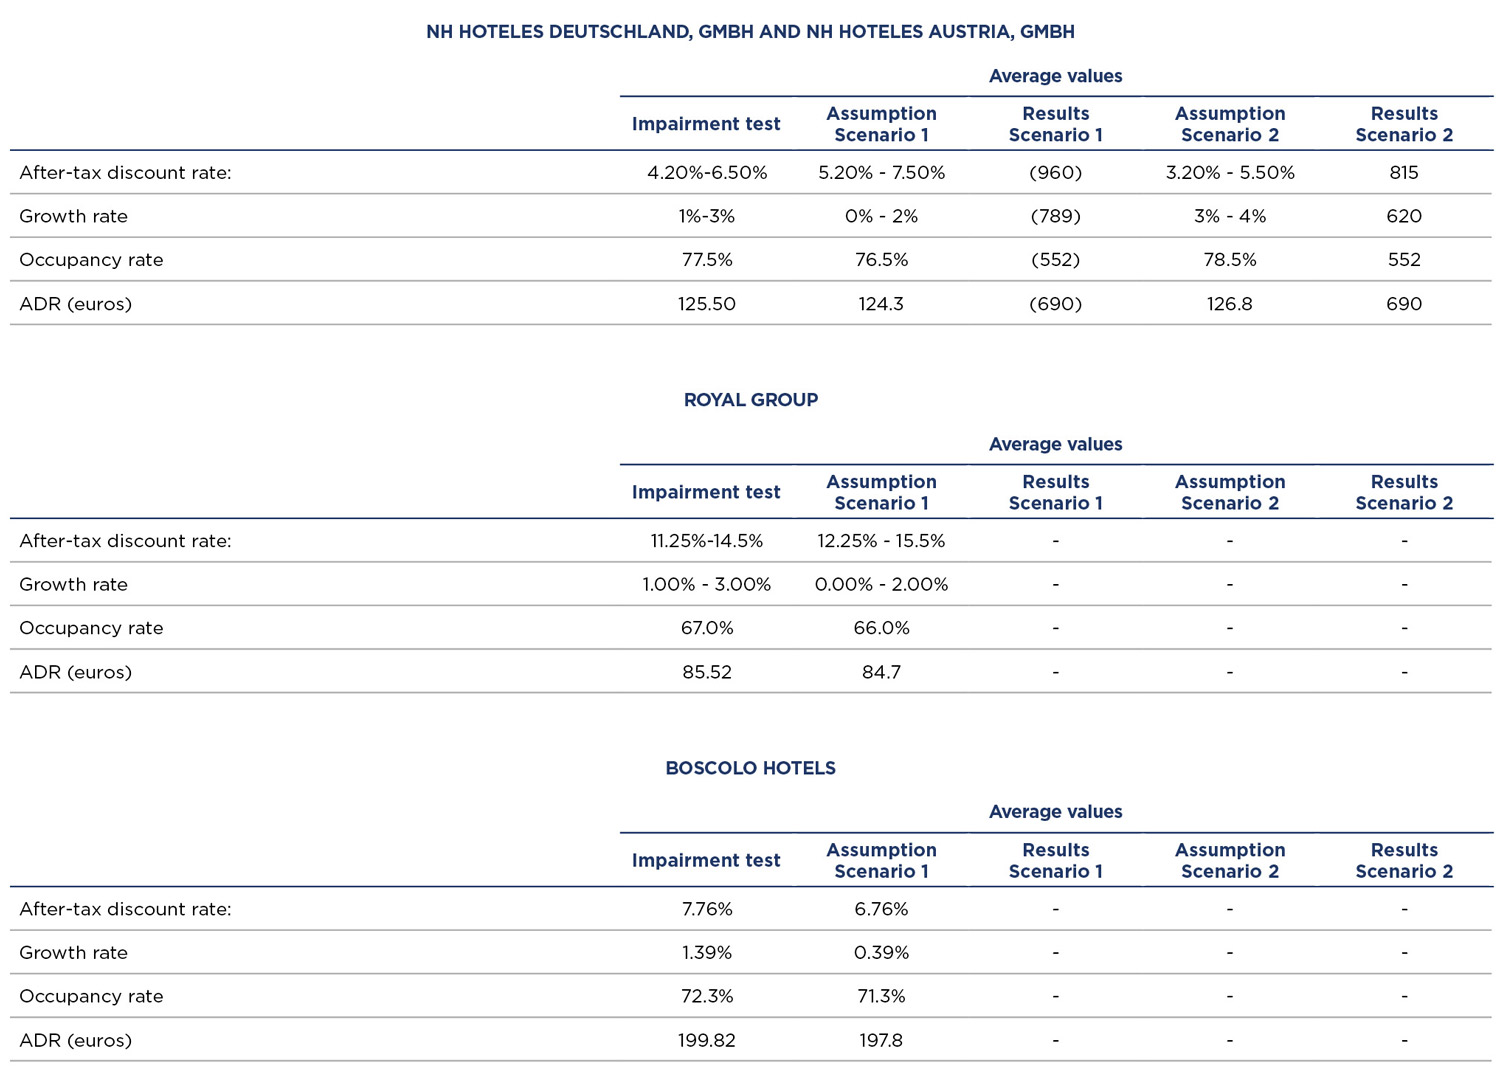
For each scenario, each hypothesis has been considered individually, recording the impact on impairment for each of them. Scenario 1 is a negative one where the discount rate is raised 100 b.p. above the rate used in the test and a growth rate lower by 100 b.p., i.e. with minimum growth, and falls in occupancy of 100 b.p. and ADR of 1% which would lead to additional impairment to that registered in 2020.

In the case of Scenario 2, this is a positive one where the discount rate is 100 b.p. below the rate used in the test, a growth rate or 100 b.p., with increases in occupancy of 100 b.p. and ADR of 1% which would lead to lower impairment to that registered in 2020.

A sensitivity analysis of the results of the impairment analysis given variations in the following scenarios, including the impacts that the amendment of each scenario would have without affecting the rest, for the main goodwill, is set out below:

In addition, a sensitivity analysis of the results of the impairment analysis of the most significant CGUs that have associated property, plant and equipment, intangible assets and rights of use is set out below:

11.3 Impairment losses

If the recoverable amount of an asset is estimated to be lower than its carrying amount, the latter is reduced to the recoverable amount by recognising the corresponding reduction through the consolidated comprehensive profit and loss statement.

If an impairment loss is subsequently reversed, the carrying amount of the asset is increased to the limit of the original value at which such asset was recognised before the loss of value was recognised.

The Group recognised a net reversal of impairment losses of 2,131 thousand euros (76,758 thousand euros allotment for impairment in 2020) as summarised below:

    • Property, plant and equipment: impairment amounting to 26,998 thousand euros was recognised in 2021 for certain tangible assets; this impairment mainly corresponds to real estate and is a result of the worsening of future expectations of cash flows for different reasons, including the opening of competitors’ hotels or the loss of an important customer and the worsening of the outlook due to the COVID-19 situation. (61,250 thousand euros in 2020). On the other hand, there was a reversal of 30,882 thousand euros resulting from the improvement in expectations, recorded under the heading “Gains/(Net losses) from asset impairment” on the consolidated comprehensive income statement for 2021 (4,523 thousand euros in 2020).
    • Right-of-use assets: an impairment reversal was recorded for Rights of use of 1,834 thousand euros and an allotment to impairment of 1,410 thousand euros (allotment of 4,333 thousand euros in 2020) (Note 8).
    • Goodwill: the Group recognised an impairment loss of 2,916 thousand euros on goodwill for NH Hoteles Deutschland, GmbH, NH Hoteles Austria, GmbH and others (14,098 thousand euros in 2020). This impairment arises from their worsening expectations of future cash flows mainly due to the opening of competitor hotels and the worsening of the outlook due to the COVID-19 situation.
    • Other intangible assets: reversals of impairment losses of 739 thousand euros (impairment losses of 1,497 thousand euros and reversals of 337 thousand euros in 2020) were recognised under “Net Gains/(Losses) on asset impairment” of the consolidated comprehensive income statement

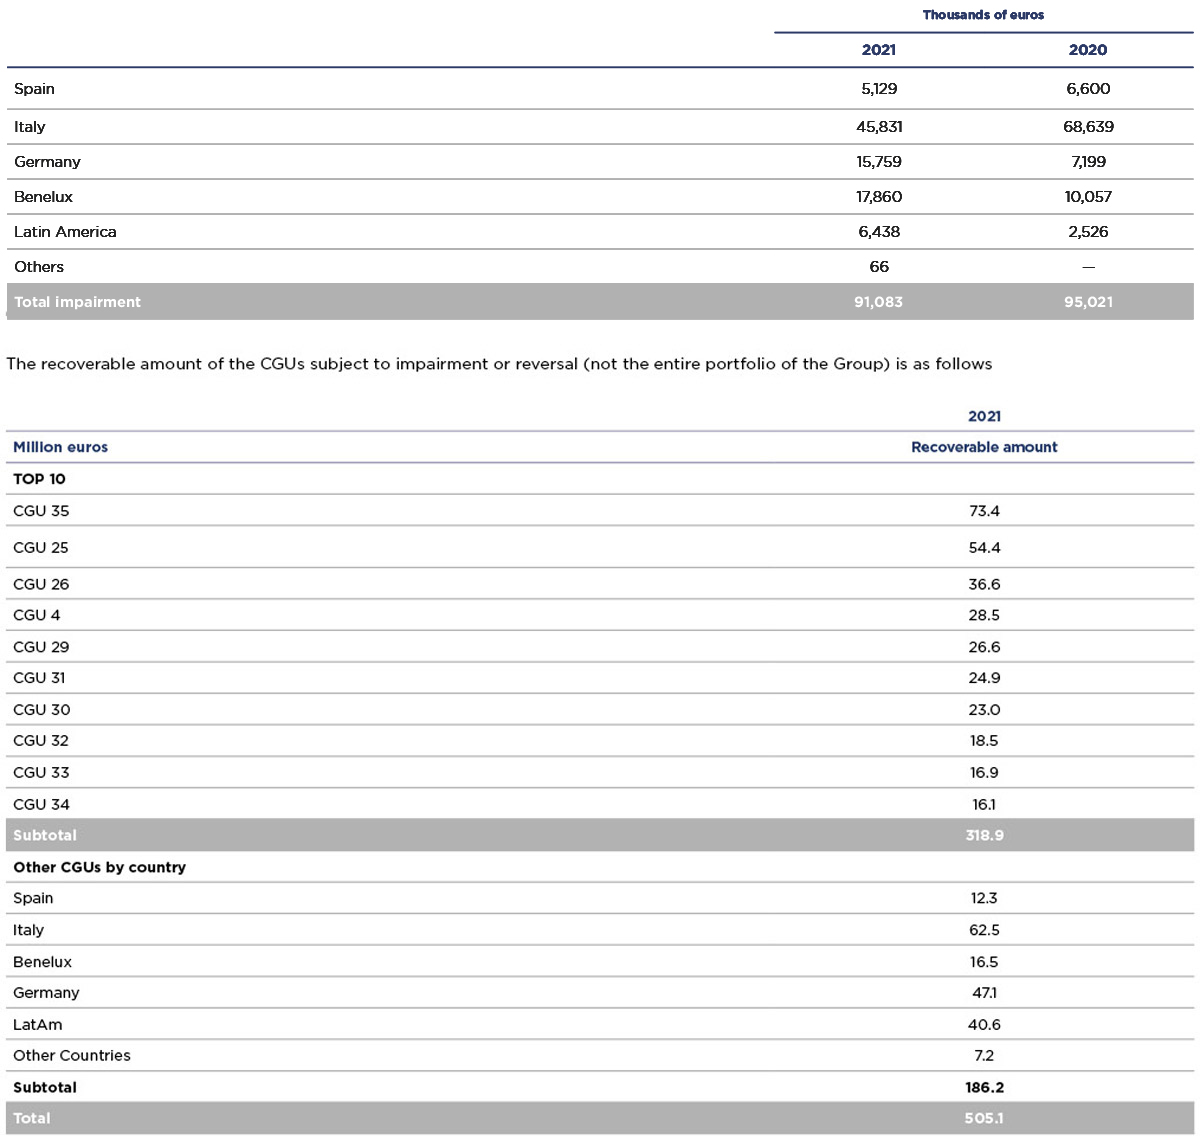
The balance of impairment to property, plant and equipment at 31 December is as follows (in thousands of euros):